Choosing a VPS isn’t just about looking at the CPU, RAM, and storage included in a plan. Performance, network connectivity, reliability, features, support, pricing, backup options, and refund policies can all play an important role when deciding whether a VPS is suitable for a particular project.
As a system administrator, I look at VPS selection much like choosing a car: there isn’t necessarily one option that is right for everyone. The right choice depends on what you intend to run and which characteristics matter most for your workload.
There are already plenty of VPS reviews available online, but many focus primarily on a single benchmark such as YABS and then draw conclusions from those results. While YABS is useful, it doesn’t tell the entire story.
For this review, I wanted to go a little further and test the VPS using several different benchmarks. The goal is to provide actual benchmark results and screenshots so that you can see the performance for yourself rather than relying solely on subjective claims.
For the performance testing, I used the following:
- YABS – CPU, storage, and network benchmarking
- CPU Steal Test – checking CPU contention during sustained load
- Sequential Disk Performance – sequential read and write throughput
- Random I/O & IOPS – small-block random storage performance
- Memory Throughput – RAM write performance
This review focuses on FFxF, an independent VPS provider based in Montreal, Quebec, Canada. I purchased the VPS myself for the purpose of testing the service and documenting my experience.
Disclosure: This review is based on my own testing of the VPS. If you use my referral link to purchase a VPS, I may receive a commission or other benefit from the provider.
Link to get 25% discount is given below.
Let’s get started.
Table of Contents
VPS configuration for the test
For this review, I purchased the Nano VPS plan from FFxF. The VPS used for all of the tests in this review had the following configuration:
Uptime     : 9 days, 22 hours, 54 minutes
Processor  : Intel(R) Xeon(R) Gold 6252 CPU @ 2.10GHz
CPU cores  : 1 @ 2095.076 MHz
AES-NI     : ✔ Enabled
VM-x/AMD-V : ✔ Enabled
RAM        : 1.9 GiB
Swap       : 0.0 KiB
Disk       : 19.6 GiB
Distro     : Debian GNU/Linux 13 (trixie)
Kernel     : 6.12.107+deb13-cloud-amd64
VM Type    : KVM
IPv4/IPv6  : ✔ Online / ✔ Online
Yabs Benchmark test
The first test i did was the Yabs test and i have pasted the output of the same below. You can even cross check the same at here https://browser.geekbench.com/v6/cpu/19228726
debian@Demo:~$ sudo curl -sL yabs.sh | bash
# ## ## ## ## ## ## ## ## ## ## ## ## ## ## ## ## ## #
#              Yet-Another-Bench-Script              #
#                     v2026-09-20                    #
# https://github.com/masonr/yet-another-bench-script #
# ## ## ## ## ## ## ## ## ## ## ## ## ## ## ## ## ## #

Mon Sep 21 08:35:59 UTC 2026

Basic System Information:
---------------------------------
Uptime     : 9 days, 22 hours, 54 minutes
Processor  : Intel(R) Xeon(R) Gold 6252 CPU @ 2.10GHz
CPU cores  : 1 @ 2095.076 MHz
AES-NI     : ✔ Enabled
VM-x/AMD-V : ✔ Enabled
RAM        : 1.9 GiB
Swap       : 0.0 KiB
Disk       : 19.6 GiB
Distro     : Debian GNU/Linux 13 (trixie)
Kernel     : 6.12.107+deb13-cloud-amd64
VM Type    : KVM
IPv4/IPv6  : ✔ Online / ✔ Online

IPv6 Network Information:
---------------------------------
ISP        : FFxF Canada
ASN        : AS402554 FFxF Canada
Host       : FFxF Canada
Location   : Montreal, Quebec (QC)
Country    : Canada

fio Disk Speed Tests (Mixed R/W 50/50) (Partition /dev/sda1):
---------------------------------
Block Size | 4k            (IOPS) | 64k           (IOPS)
  ------   | ---            ----  | ----           ----
Read       | 98.48 MB/s   (24.0k) | 554.16 MB/s   (8.4k)
Write      | 98.74 MB/s   (24.1k) | 557.08 MB/s   (8.5k)
Total      | 197.23 MB/s  (48.1k) | 1.11 GB/s    (16.9k)
           |                      |
Block Size | 512k          (IOPS) | 1m            (IOPS)
  ------   | ---            ----  | ----           ----
Read       | 201.02 MB/s    (383) | 542.91 MB/s    (517)
Write      | 211.71 MB/s    (403) | 579.07 MB/s    (552)
Total      | 412.73 MB/s    (786) | 1.12 GB/s     (1.0k)

iperf3 Network Speed Tests (IPv4):
---------------------------------
Provider        | Location (Link)           | Send Speed      | Recv Speed                                                                                    | Ping
-----           | -----                     | ----            | ----                                                                                          | ----
Clouvider       | London, UK (10G)          | 886 Mbits/sec   | 521 Mbits/sec                                                                                 | 71.7 ms
Eranium         | Amsterdam, NL (100G)      | 824 Mbits/sec   | 784 Mbits/sec                                                                                 | 80.0 ms
Uztelecom       | Tashkent, UZ (10G)        | 538 Mbits/sec   | 223 Mbits/sec                                                                                 | 196 ms
Leaseweb        | Singapore, SG (10G)       | 430 Mbits/sec   | 529 Mbits/sec                                                                                 | 228 ms
Clouvider       | Los Angeles, CA, US (10G) | 787 Mbits/sec   | 581 Mbits/sec                                                                                 | 57.1 ms
Leaseweb        | NYC, NY, US (10G)         | 938 Mbits/sec   | 932 Mbits/sec                                                                                 | 10.3 ms
Edgoo           | Sao Paulo, BR (1G)        | 757 Mbits/sec   | 299 Mbits/sec                                                                                 | 118 ms

iperf3 Network Speed Tests (IPv6):
---------------------------------
Provider        | Location (Link)           | Send Speed      | Recv Speed                                                                                    | Ping
-----           | -----                     | ----            | ----                                                                                          | ----
Clouvider       | London, UK (10G)          | 829 Mbits/sec   | 471 Mbits/sec                                                                                 | 71.6 ms
Eranium         | Amsterdam, NL (100G)      | 864 Mbits/sec   | 819 Mbits/sec                                                                                 | 80.5 ms
Uztelecom       | Tashkent, UZ (10G)        | 727 Mbits/sec   | 159 Mbits/sec                                                                                 | 196 ms
Leaseweb        | Singapore, SG (10G)       | 396 Mbits/sec   | 542 Mbits/sec                                                                                 | 239 ms
Clouvider       | Los Angeles, CA, US (10G) | 845 Mbits/sec   | 465 Mbits/sec                                                                                 | 57.3 ms
Leaseweb        | NYC, NY, US (10G)         | 925 Mbits/sec   | 925 Mbits/sec                                                                                 | 9.92 ms
Edgoo           | Sao Paulo, BR (1G)        | 770 Mbits/sec   | 228 Mbits/sec                                                                                 | 117 ms

Geekbench 6 Benchmark Test:
---------------------------------
Test            | Value
                |
Single Core     |
Multi Core      |
Full Test       | https://browser.geekbench.com/v6/cpu/19228726

YABS completed in 16 min 34 sec
The YABS network tests achieved speeds approaching 1 Gbps on several test locations, with the highest recorded IPv4 result reaching 938 Mbps upload and 932 Mbps download to the New York City test server. Actual network performance will vary depending on the destination and network conditions. You will also see that they offer nested virtualization too which is highly beneficial when you need to host virtualization tools like Proxmox. So if you need a VPS with nested virtualization, you can pick this.
CPU Steal
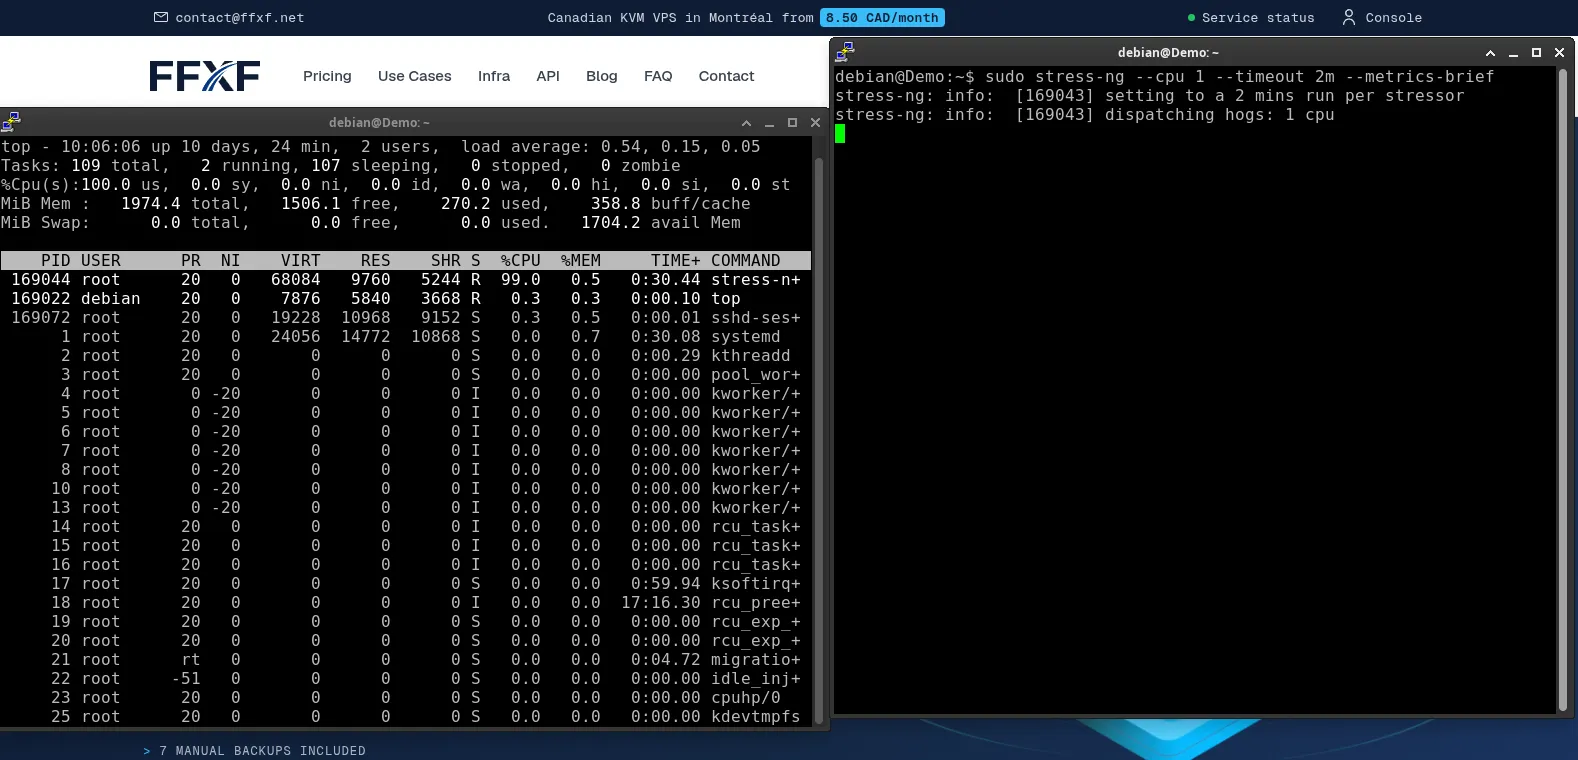
CPU steal is the nightmare for system administrators. I have seen many VPS’s hovering around 5 or even 10. This test shows that someone on the same node is running the VPS at full throttle and to maintain the performance, CPU resources of your VPS is being used.
But with FFxf i had run the stress test continuously for 2 minutes in which the CPU was running continuously at 95 to 100% and on the other terminal, i was continuously monitoring using top. I didn’t even noticed even a drop of steal time during the test. Check out the screenshots below
Sequential Write performance
Now lets move to Sequential write performance test. This test shows us the benchmark and speed to write on a disk. For this test, I used fio with a 4 GiB test file, a 1 MiB block size, a queue depth of 32, direct I/O, and a single worker. The test ran for 60 seconds. Here is the result
debian@Demo:~$ fio --name=seq-write \
    --filename=$HOME/fio-test/testfile \
    --size=4G \
    --bs=1M \
    --rw=write \
    --ioengine=libaio \
    --direct=1 \
    --iodepth=32 \
    --numjobs=1 \
    --runtime=60 \
    --time_based \
    --group_reporting
seq-write: (g=0): rw=write, bs=(R) 1024KiB-1024KiB, (W) 1024KiB-1024KiB, (T) 1024KiB-1024KiB, ioengine=libaio, iodepth=32
fio-3.39
Starting 1 process
seq-write: Laying out IO file (1 file / 4096MiB)
Jobs: 1 (f=1): [W(1)][100.0%][w=45.0MiB/s][w=45 IOPS][eta 00m:00s]
seq-write: (groupid=0, jobs=1): err= 0: pid=169235: Mon Sep 21 10:11:58 2026
  write: IOPS=229, BW=230MiB/s (241MB/s)(13.8GiB/61663msec); 0 zone resets
    slat (usec): min=24, max=33818, avg=170.64, stdev=288.04
    clat (usec): min=1204, max=12322k, avg=139134.99, stdev=271100.08
     lat (usec): min=1280, max=12322k, avg=139305.63, stdev=271100.55
    clat percentiles (msec):
     |  1.00th=[    3],  5.00th=[   32], 10.00th=[   32], 20.00th=[   32],
     | 30.00th=[   33], 40.00th=[   62], 50.00th=[  103], 60.00th=[  136],
     | 70.00th=[  155], 80.00th=[  211], 90.00th=[  279], 95.00th=[  418],
     | 99.00th=[  617], 99.50th=[  743], 99.90th=[ 1720], 99.95th=[ 1838],
     | 99.99th=[12281]
   bw (  KiB/s): min=57344, max=1226752, per=100.00%, avg=240994.21, stdev=247133.53, samples=120
   iops        : min=   56, max= 1198, avg=235.34, stdev=241.34, samples=120
  lat (msec)   : 2=0.75%, 4=1.11%, 10=1.71%, 20=0.45%, 50=35.00%
  lat (msec)   : 100=9.93%, 250=37.58%, 500=10.74%, 750=2.25%, 1000=0.19%
  lat (msec)   : 2000=0.26%, >=2000=0.04%
  cpu          : usr=2.92%, sys=1.42%, ctx=14102, majf=0, minf=10
  IO depths    : 1=0.1%, 2=0.1%, 4=0.1%, 8=0.1%, 16=0.1%, 32=99.8%, >=64=0.0%
     submit    : 0=0.0%, 4=100.0%, 8=0.0%, 16=0.0%, 32=0.0%, 64=0.0%, >=64=0.0%
     complete  : 0=0.0%, 4=100.0%, 8=0.0%, 16=0.0%, 32=0.1%, 64=0.0%, >=64=0.0%
     issued rwts: total=0,14152,0,0 short=0,0,0,0 dropped=0,0,0,0
     latency   : target=0, window=0, percentile=100.00%, depth=32

Run status group 0 (all jobs):
  WRITE: bw=230MiB/s (241MB/s), 230MiB/s-230MiB/s (241MB/s-241MB/s), io=13.8GiB (14.8GB), run=61663-61663msec

Disk stats (read/write):
  sda: ios=0/14417, sectors=0/28981880, merge=0/46, ticks=0/1926714, in_queue=1947500, util=93.13%
Test Result – Sequential Write 230 MiB/s
Sequential Read performance
Now lets perform the test for read operation. This test will show the benchmark of how fast the system do the read operations. For the 4K random-read test, I used fio with a 4 KiB block size, a queue depth of 32, and a single worker for 60 seconds. Here is the test result
debian@Demo:~$ fio --name=seq-read \
    --filename=$HOME/fio-test/testfile \
    --size=4G \
    --bs=1M \
    --rw=read \
    --ioengine=libaio \
    --direct=1 \
    --iodepth=32 \
    --numjobs=1 \
    --runtime=60 \
    --time_based \
    --group_reporting
seq-read: (g=0): rw=read, bs=(R) 1024KiB-1024KiB, (W) 1024KiB-1024KiB, (T) 1024KiB-1024KiB, ioengine=libaio, iodepth=32
fio-3.39
Starting 1 process
Jobs: 1 (f=1): [R(1)][100.0%][r=1000MiB/s][r=1000 IOPS][eta 00m:00s]
seq-read: (groupid=0, jobs=1): err= 0: pid=169295: Mon Sep 21 10:24:29 2026
  read: IOPS=1001, BW=1002MiB/s (1050MB/s)(58.7GiB/60032msec)
    slat (usec): min=4, max=1994, avg=44.12, stdev=26.39
    clat (usec): min=1706, max=77582, avg=31893.64, stdev=1822.24
     lat (usec): min=1715, max=77615, avg=31937.76, stdev=1819.35
    clat percentiles (usec):
     |  1.00th=[31327],  5.00th=[31589], 10.00th=[31589], 20.00th=[31851],
     | 30.00th=[31851], 40.00th=[31851], 50.00th=[31851], 60.00th=[32113],
     | 70.00th=[32113], 80.00th=[32113], 90.00th=[32113], 95.00th=[32375],
     | 99.00th=[32637], 99.50th=[32637], 99.90th=[51643], 99.95th=[60556],
     | 99.99th=[71828]
   bw (  KiB/s): min=1021952, max=1220215, per=100.00%, avg=1026733.10, stdev=17921.87, samples=119
   iops        : min=  998, max= 1191, avg=1002.66, stdev=17.45, samples=119
  lat (msec)   : 2=0.01%, 4=0.01%, 10=0.28%, 20=0.09%, 50=99.50%
  lat (msec)   : 100=0.11%
  cpu          : usr=0.93%, sys=6.66%, ctx=60121, majf=0, minf=537
  IO depths    : 1=0.1%, 2=0.1%, 4=0.1%, 8=0.1%, 16=0.1%, 32=99.9%, >=64=0.0%
     submit    : 0=0.0%, 4=100.0%, 8=0.0%, 16=0.0%, 32=0.0%, 64=0.0%, >=64=0.0%
     complete  : 0=0.0%, 4=100.0%, 8=0.0%, 16=0.0%, 32=0.1%, 64=0.0%, >=64=0.0%
     issued rwts: total=60129,0,0,0 short=0,0,0,0 dropped=0,0,0,0
     latency   : target=0, window=0, percentile=100.00%, depth=32

Run status group 0 (all jobs):
   READ: bw=1002MiB/s (1050MB/s), 1002MiB/s-1002MiB/s (1050MB/s-1050MB/s), io=58.7GiB (63.0GB), run=60032-60032msec

Disk stats (read/write):
  sda: ios=59993/103, sectors=122865664/944, merge=0/11, ticks=1913225/144, in_queue=1913394, util=96.63%
Test Result – Sequential Read 1002 MiB/s
Random I/O + IOPS
Now lets do the randon I/O + IOPS test. With this test we can find out the speed of the VPS/database workload. Here is the output
debian@Demo:~$ fio --name=rand-read-4k \
    --filename=$HOME/fio-test/testfile \
    --size=4G \
    --bs=4k \
    --rw=randread \
    --ioengine=libaio \
    --direct=1 \
    --iodepth=32 \
    --numjobs=1 \
    --runtime=60 \
    --time_based \
    --group_reporting
rand-read-4k: (g=0): rw=randread, bs=(R) 4096B-4096B, (W) 4096B-4096B, (T) 4096B-4096B, ioengine=libaio, iodepth=32
fio-3.39
Starting 1 process
Jobs: 1 (f=1): [r(1)][100.0%][r=62.5MiB/s][r=16.0k IOPS][eta 00m:00s]
rand-read-4k: (groupid=0, jobs=1): err= 0: pid=169350: Mon Sep 21 10:35:55 2026
  read: IOPS=40.0k, BW=156MiB/s (164MB/s)(9375MiB/60002msec)
    slat (nsec): min=1856, max=1455.9k, avg=6005.34, stdev=3800.62
    clat (usec): min=104, max=6727, avg=793.37, stdev=405.30
     lat (usec): min=106, max=6738, avg=799.38, stdev=405.92
    clat percentiles (usec):
     |  1.00th=[  586],  5.00th=[  619], 10.00th=[  627], 20.00th=[  644],
     | 30.00th=[  652], 40.00th=[  652], 50.00th=[  660], 60.00th=[  668],
     | 70.00th=[  676], 80.00th=[  693], 90.00th=[ 1876], 95.00th=[ 1991],
     | 99.00th=[ 2073], 99.50th=[ 2073], 99.90th=[ 2114], 99.95th=[ 2114],
     | 99.99th=[ 2278]
   bw (  KiB/s): min=64016, max=230312, per=100.00%, avg=160851.15, stdev=55461.95, samples=119
   iops        : min=16004, max=57578, avg=40212.82, stdev=13865.50, samples=119
  lat (usec)   : 250=0.31%, 500=0.14%, 750=87.70%, 1000=1.73%
  lat (msec)   : 2=6.10%, 4=4.02%, 10=0.01%
  cpu          : usr=7.03%, sys=32.12%, ctx=1442502, majf=0, minf=41
  IO depths    : 1=0.1%, 2=0.1%, 4=0.1%, 8=0.1%, 16=0.1%, 32=100.0%, >=64=0.0%
     submit    : 0=0.0%, 4=100.0%, 8=0.0%, 16=0.0%, 32=0.0%, 64=0.0%, >=64=0.0%
     complete  : 0=0.0%, 4=100.0%, 8=0.0%, 16=0.0%, 32=0.1%, 64=0.0%, >=64=0.0%
     issued rwts: total=2400023,0,0,0 short=0,0,0,0 dropped=0,0,0,0
     latency   : target=0, window=0, percentile=100.00%, depth=32

Run status group 0 (all jobs):
   READ: bw=156MiB/s (164MB/s), 156MiB/s-156MiB/s (164MB/s-164MB/s), io=9375MiB (9830MB), run=60002-60002msec

Disk stats (read/write):
  sda: ios=2398394/56, sectors=19187152/496, merge=0/3, ticks=1890624/54, in_queue=1890688, util=85.39%
Test Result – 4K random read: 40,000 IOPS / 156 MiB/s
Memory Throughput
Next, I tested the VPS’s memory throughput using Sysbench. Unlike the fio tests above, this test does not measure storage performance. It measures how quickly the system can perform memory operations in RAM.
I used a 1 MiB memory block, transferred a total of 10 GiB of data, and used a single thread to match the VPS’s 1-vCPU configuration. Here is the results
debian@Demo:~$ sysbench memory \
    --memory-block-size=1M \
    --memory-total-size=10G \
    --threads=1 \
    run
sysbench 1.0.20 (using system LuaJIT 2.1.1700206165)

Running the test with following options:
Number of threads: 1
Initializing random number generator from current time


Running memory speed test with the following options:
  block size: 1024KiB
  total size: 10240MiB
  operation: write
  scope: global

Initializing worker threads...

Threads started!

Total operations: 10240 (18395.24 per second)

10240.00 MiB transferred (18395.24 MiB/sec)

The test completed in 0.5551 seconds with an average reported latency of 0.05 ms.


General statistics:
    total time:                          0.5551s
    total number of events:              10240

Latency (ms):
         min:                                    0.05
         avg:                                    0.05
         max:                                    0.21
         95th percentile:                        0.07
         sum:                                  550.98

Threads fairness:
    events (avg/stddev):           10240.0000/0.00
    execution time (avg/stddev):   0.5510/0.00
Test Result – Sysbench memory write: 18,395 MiB/s
So as you can see being a VPS with just 1vcpu and 2GB ram, the VPS performed really well. I would rate the performance as 9.5/10.
Features Offered by the FFxF on their VPS plans
Now that we are sure that performance of the VPS is genuinely awesome. But we cant just rely on the performance before making the purchase. We will see what all things they offer
IPv4 and IPv6
With each VPS plan, you get 1 IPv4 and 1 IPv6 as default. Which means, your VPS can communicate using both IPv4 and IPv6 in the real world scenario.
100% Dedicated Resources
On the website FFxF.net, you will see that the provider offers 100% dedicated resources. Which mean you get all the resources what you have paid for. Its not just a marketting gimmik, our tests proves that. So you should rest assured that you will never have to face any slowness or fluctuation in performance even when your neighbour on the same node is utilizing high amount of resources.
7 Manual Backups
Backups are the most important part and every hosting provider knows this. Most of the providers charge a good amount of fees for backups, but with FFxf, you dont have to pay for 7 backups. Means on your console, you will get option to backup your server and you can restore it whenever you want.

VNC Console
In case, you locked yourself out of your VPS while making wrong configuration or for any other reason, you dont have to worry as within your console you will have the option to connect directly to your VPS and make required fixes.

Operating Systems
FFxF offers you almost all the Linux based operating systems to setup your VPS. Here are some of them Debian, Ubuntu, Fedora, Rocky Linux, AlmaLinux, CentOS Stream, FreeBSD, ekkoBSD, Arch Linux, NixOS, Alpine Linux, MetaTrader, Windows, Hermes Agent, OpenClaw, n8n, Coolify, Docker, WordPress, Pelican Panel, WireGuard, Dify, code-server, Nextcloud, Seafile, Gitea, Matomo, Uptime Kuma, Plausible, Umami, Open WebUI, Forgejo, PostgreSQL + pgvector, MySQL, NetBird, Vaultwarden, Immich
Payment in Crypto
Along with other payments methods, they accept crypto payments too. So if you want you can make payments in crypto.
Moneyback Guarantee
Even after making a purchase, you can ask for a refund. They wont even ask you “why”. They offer a 7 days money back guarantee on the first invoice. Just raise a ticket from console and you are done. You will get your money back.
Conclusion
No doubt, FFxf.net VPS offers great and very important features with their VPS that make your setup highly reliable and value for money. So whether you install docker, install WordPress, install Zabbix, or do any kind of setup, the performance and features ensures that your setup runs smoothly. Click Here to get 25% discount while making a purchase.
